ESG Reporting Cycle: A Sustainability Manager's Honest Account of What One Year Actually Looks Like
What does a full ESG reporting year actually look like? From chasing missing data and fixing reporting errors to navigating changing frameworks and preparing for assurance audits, this blog explores the real challenges sustainability managers face and why better data management makes all the difference.



Table of Contents


The year always ends the same way
I have run enough reporting cycles to know exactly how they end: at 11 p.m., spreadsheet open on one screen, the auditor's query list on the other, and a WhatsApp message from a plant engineer that begins with "Sorry, I think we sent you the wrong number."
What follows is one of those years, compressed, anonymised, and honest about where it hurt. This is what a full ESG reporting cycle actually looks like from the inside, and if you manage sustainability data for a listed company in India, the Gulf, or the UK, you will recognise every month of it.
April: The ESG data collection problem nobody talks about
The second week of April. The Pune plant hasn't submitted water withdrawal data. The Sharjah facility's manager assures me the meter readings are "with the maintenance team." I am rebuilding energy consumption for the last quarter from a folder of PDF electricity bills, some scanned sideways, working from four spreadsheet versions with names like ESG_data_FINAL_v3_USE_THIS_ONE.
The deeper problem was never the chasing itself. No one owned the numbers. When Pune's figures finally arrived, I had no way to know whether they were meter readings, estimates, or last year's numbers copied forward. One plant reported water in kilolitres, another in gallons. I converted by hand, which is exactly how a decimal point ends up in the wrong place at midnight.
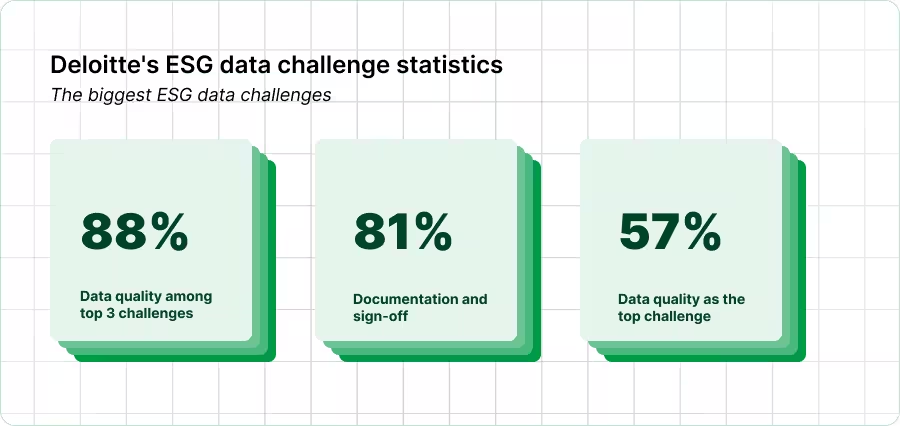
Deloitte's 2024 Sustainability Action Report, which surveyed 300 executives, found that 57% cited data quality as their company's top ESG data challenge, with 88% ranking it among their top three. Documentation and sign-off came in close behind, flagged by 81%. A separate 2025 study by Ditto found that 72% of professionals spend most of their time collecting and consolidating data, and 65% spend it chasing colleagues or suppliers.
The system didn't chase. I did.
May: ESG data quality errors you cannot see until it's too late
By May the numbers were mostly in, which only revealed the next problem: I couldn't trust them.
The Chennai site's electricity consumption had tripled year-on-year. Was that a real operational change, a new production line, or a transcription error? I had no way to know without emailing the site and waiting two days. And this wasn't a one-off. The same consolidated electricity bill had been entered at the site level and again at the group level. On a spreadsheet, that's invisible until someone notices the total looks high. In our case, someone did, barely, two days before the draft went to the board.
KPMG's 2024 ESG Organization Survey of 550 board members and executives found that 83% believed their organisations were ahead of their peers on reporting, yet 47% were still using spreadsheets to manage their ESG data. Nearly half the market is running mandatory, audit-facing disclosure through the same tool they use for expense reports, while being confident they're winning.
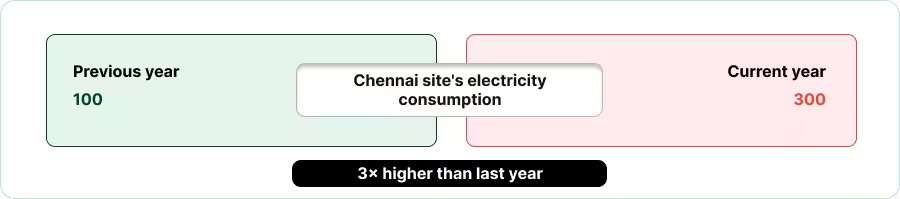
What I needed for Chennai was a flag that said why, something like "this site's consumption is 300% above its own prior-year figure." I also needed wrong numbers bounced back to the submitter with comments, and the full revision history kept, so when the auditor later asked what changed, I had an answer instead of a shrug.
Data quality issues account for roughly 40% of all ESG assurance findings (Glocert International). If you want the full financial picture of what that costs, [the True Cost blog] breaks it down across assurance fees, penalties, and lost contracts.
July: When ESG reporting frameworks change mid-cycle
The frameworks don't hold still while you're reporting against them
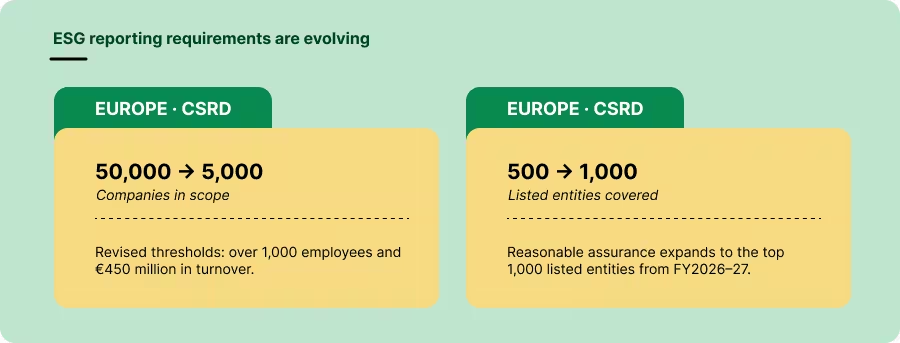
Mid-cycle, our EU subsidiary's legal team called. They'd read something about the Omnibus package and wanted to know whether they were even in scope for CSRD anymore. The mandatory threshold had been raised to companies with over 1,000 employees and €450 million in turnover, cutting in-scope companies from roughly 50,000 to 5,000 (Directive (EU) 2026/470). That sounded like good news until I realised the board had already approved a CSRD roadmap with budget attached.
Meanwhile in India, the BRSR Core assurance expansion was moving exactly as planned. The top 500 listed entities were now in scope for reasonable assurance this year, heading to the full top 1,000 from FY2026-27. Reasonable assurance means larger samples, tested internal controls, and a positive opinion on data reliability, which is a higher bar than limited assurance.
On a spreadsheet, when a framework revises a metric's definition, you either silently overwrite history or spawn another version. Either way, your prior-year comparisons are at risk. What I wanted was for past periods to stay locked to the definition that applied when they were submitted, with new periods using the updated one, so an auditor comparing 2024 to 2025 could see which definition applied to each year.
September: Multi-framework ESG reporting under deadline
September is when everything is due at once, and each framework wants the same data formatted differently.
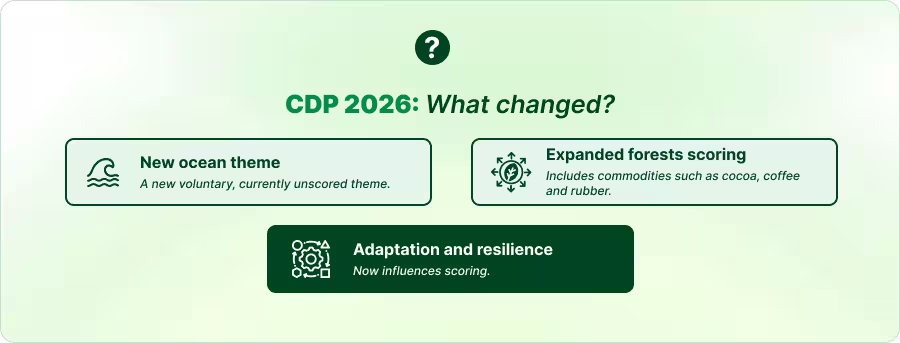
The CDP 2026 cycle had changed again. A new ocean theme added, forests scoring expanded to include cocoa, coffee, and rubber, adaptation and resilience now affecting the score. GRI's updated Biodiversity Standard had taken effect from January.
The old way meant entering the same water figure into the BRSR template, the GRI index, and the CDP questionnaire separately, and the three numbers then had to agree with each other at reporting time, when there was no time left to find out why they didn't.
What I wanted was to enter a value once, tag it to every framework it applies to, and have it flow into each disclosure without re-entry. If you're evaluating platforms on this, [the Buyer's Guide] covers it under metric management and report generation, including what to ask in a demo.
January: What an ESG assurance audit actually asks
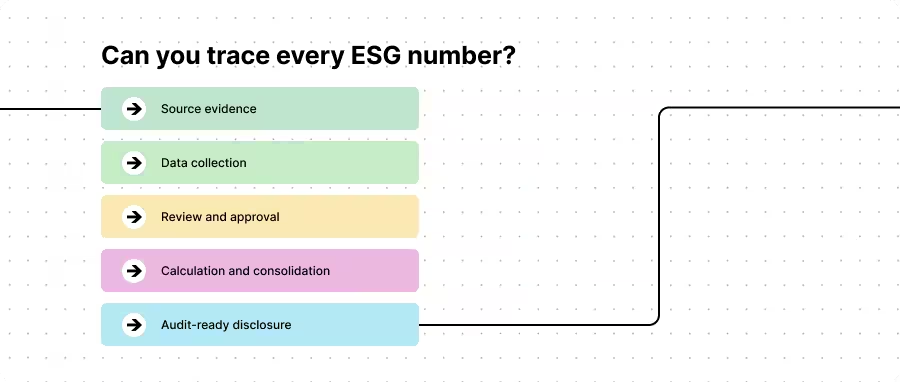
Then comes assurance. And the auditor didn't ask to see the report.
She asked to see how the number was made.
"Where did this emissions figure come from? Show me the source document. Who entered it, who approved it, and what changed between the first draft and this one? Which consolidation approach did you use for the joint venture (equity share, operational control, or financial control) and was it applied consistently?"
Boundary inconsistencies between ESG and financial reporting perimeters come up in nearly every first-time engagement. And with ISSA 5000, effective for periods beginning on or after 15 December 2026, the standard has sharpened. Under SEBI's BRSR Core regime, questions like these now carry reasonable-assurance weight.
The Deloitte data captures the readiness gap directly: 80% of organisations say they are taking steps to move from limited to reasonable assurance, but only 13% have completed their evaluation of the next steps to take. Among private companies, 72% have not even completed their review.
What saves teams that are ready is data lineage per data point. Every figure carrying its source type: manual entry, OCR from a specific bill, API feed from a smart meter, or a derived calculation. Evidence attached at submission, not reconstructed later. Every step logged. An assurance export you can hand the auditor as a companion document on day one, not something you're rebuilding under deadline.
What one full ESG reporting cycle taught me
The problems came up in the same places every time: collecting the data, checking it, keeping up with framework changes, and the audit. Most of it came from handling sustainability data as a year-end spreadsheet task, with no owners, no record of changes and no controls.
BRSR Core reasonable assurance, ISSA 5000 and CBAM’s definitive period (live since 1 January 2026, first certificate surrender due 30 September 2027) all require numbers that can be traced back to a source.
I was also building two versions of the same data, one for the plant manager and one for the board. When that stopped, I saw how much time it had been taking.
To see how KarbunWise maps to your reporting calendar, book a walkthrough with our team. Bring your worst 11 p.m. story.
{{cta}}
{{accordion}}
{{sources}}

Continue Reading

Top 5 ESG Software Platforms in 2026: Features and Use Cases
Compare the top 5 ESG software platforms in 2026 and find the right fit for your reporting, carbon, LCA, and compliance needs.